After the start of the pandemic, we noticed that the trends and habits of the sales people using our CRM were changing, making working from desktop environment more commonplace. Videocalls and remote activity management led to more web-based interaction. This caused the traffic of some functionalities to increase exponentially, which allowed us to detect new areas for improvement in terms of user experience and interface design.
- 1.Improve the hierarchy of information
The activity feed needs to clearly differentiate the different sections of each of the elements to improve the reading and ensure that important information is being read.
- 2.Consistency
Both at the interface and flow design level, there is a need to improve consistency with other sections of the web app.
- 3.Improvement of some functionalities
Being able to add images from the web, linking activities to opportunities...
We needed to integrate the whole activity page into the concept we were developing in parallel in the web design library.

- 1.Project information.
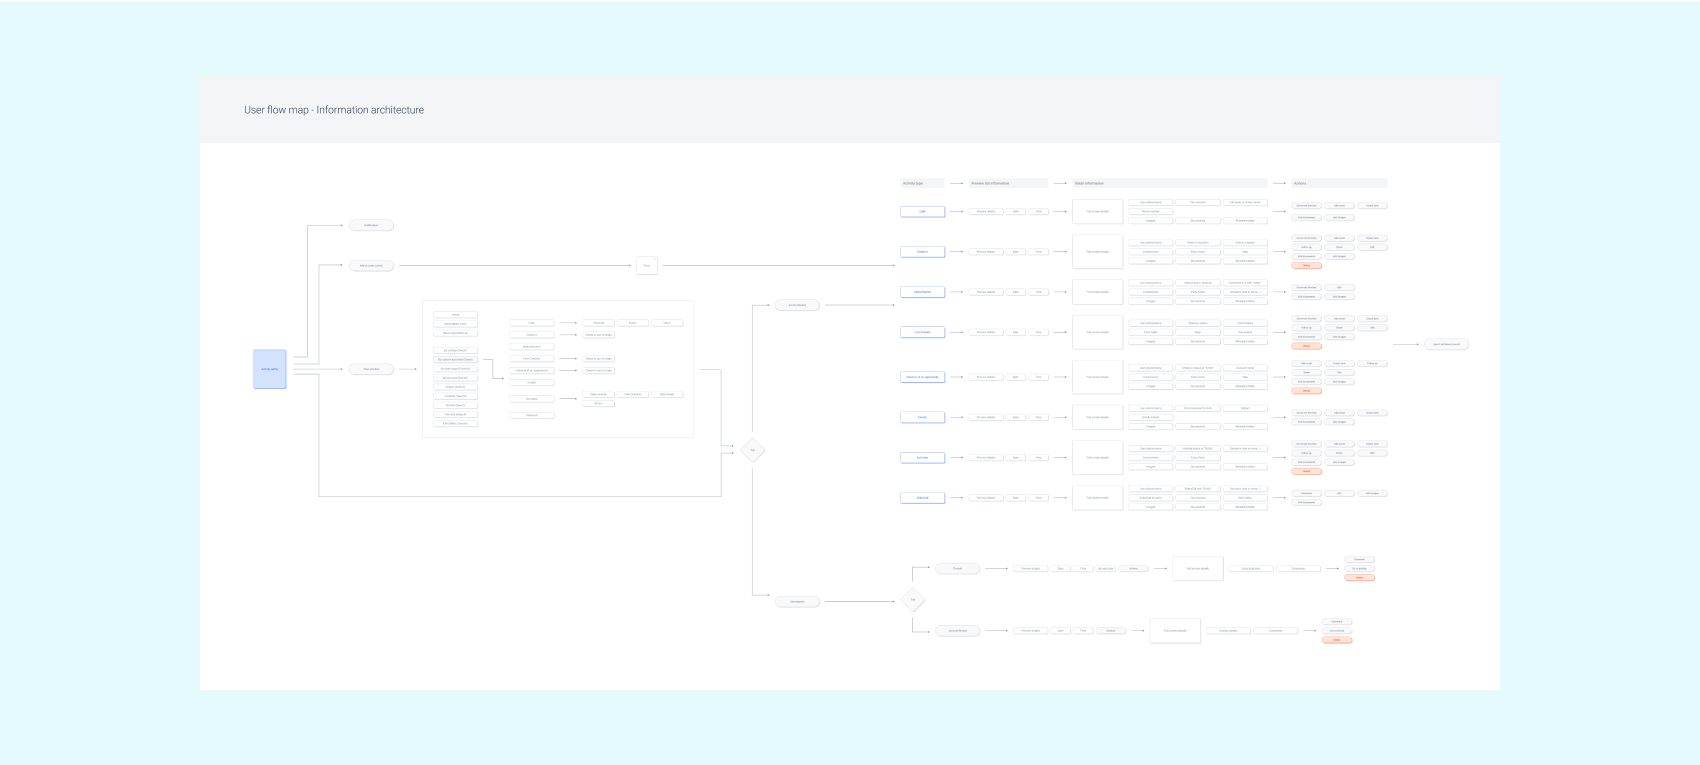
In addition to the initial problem, we defined a workflow to map in depth the behaviour of all the functionalities in order to move on to the next step and start the process of user research and interviews.
- 2.Research and interviews.
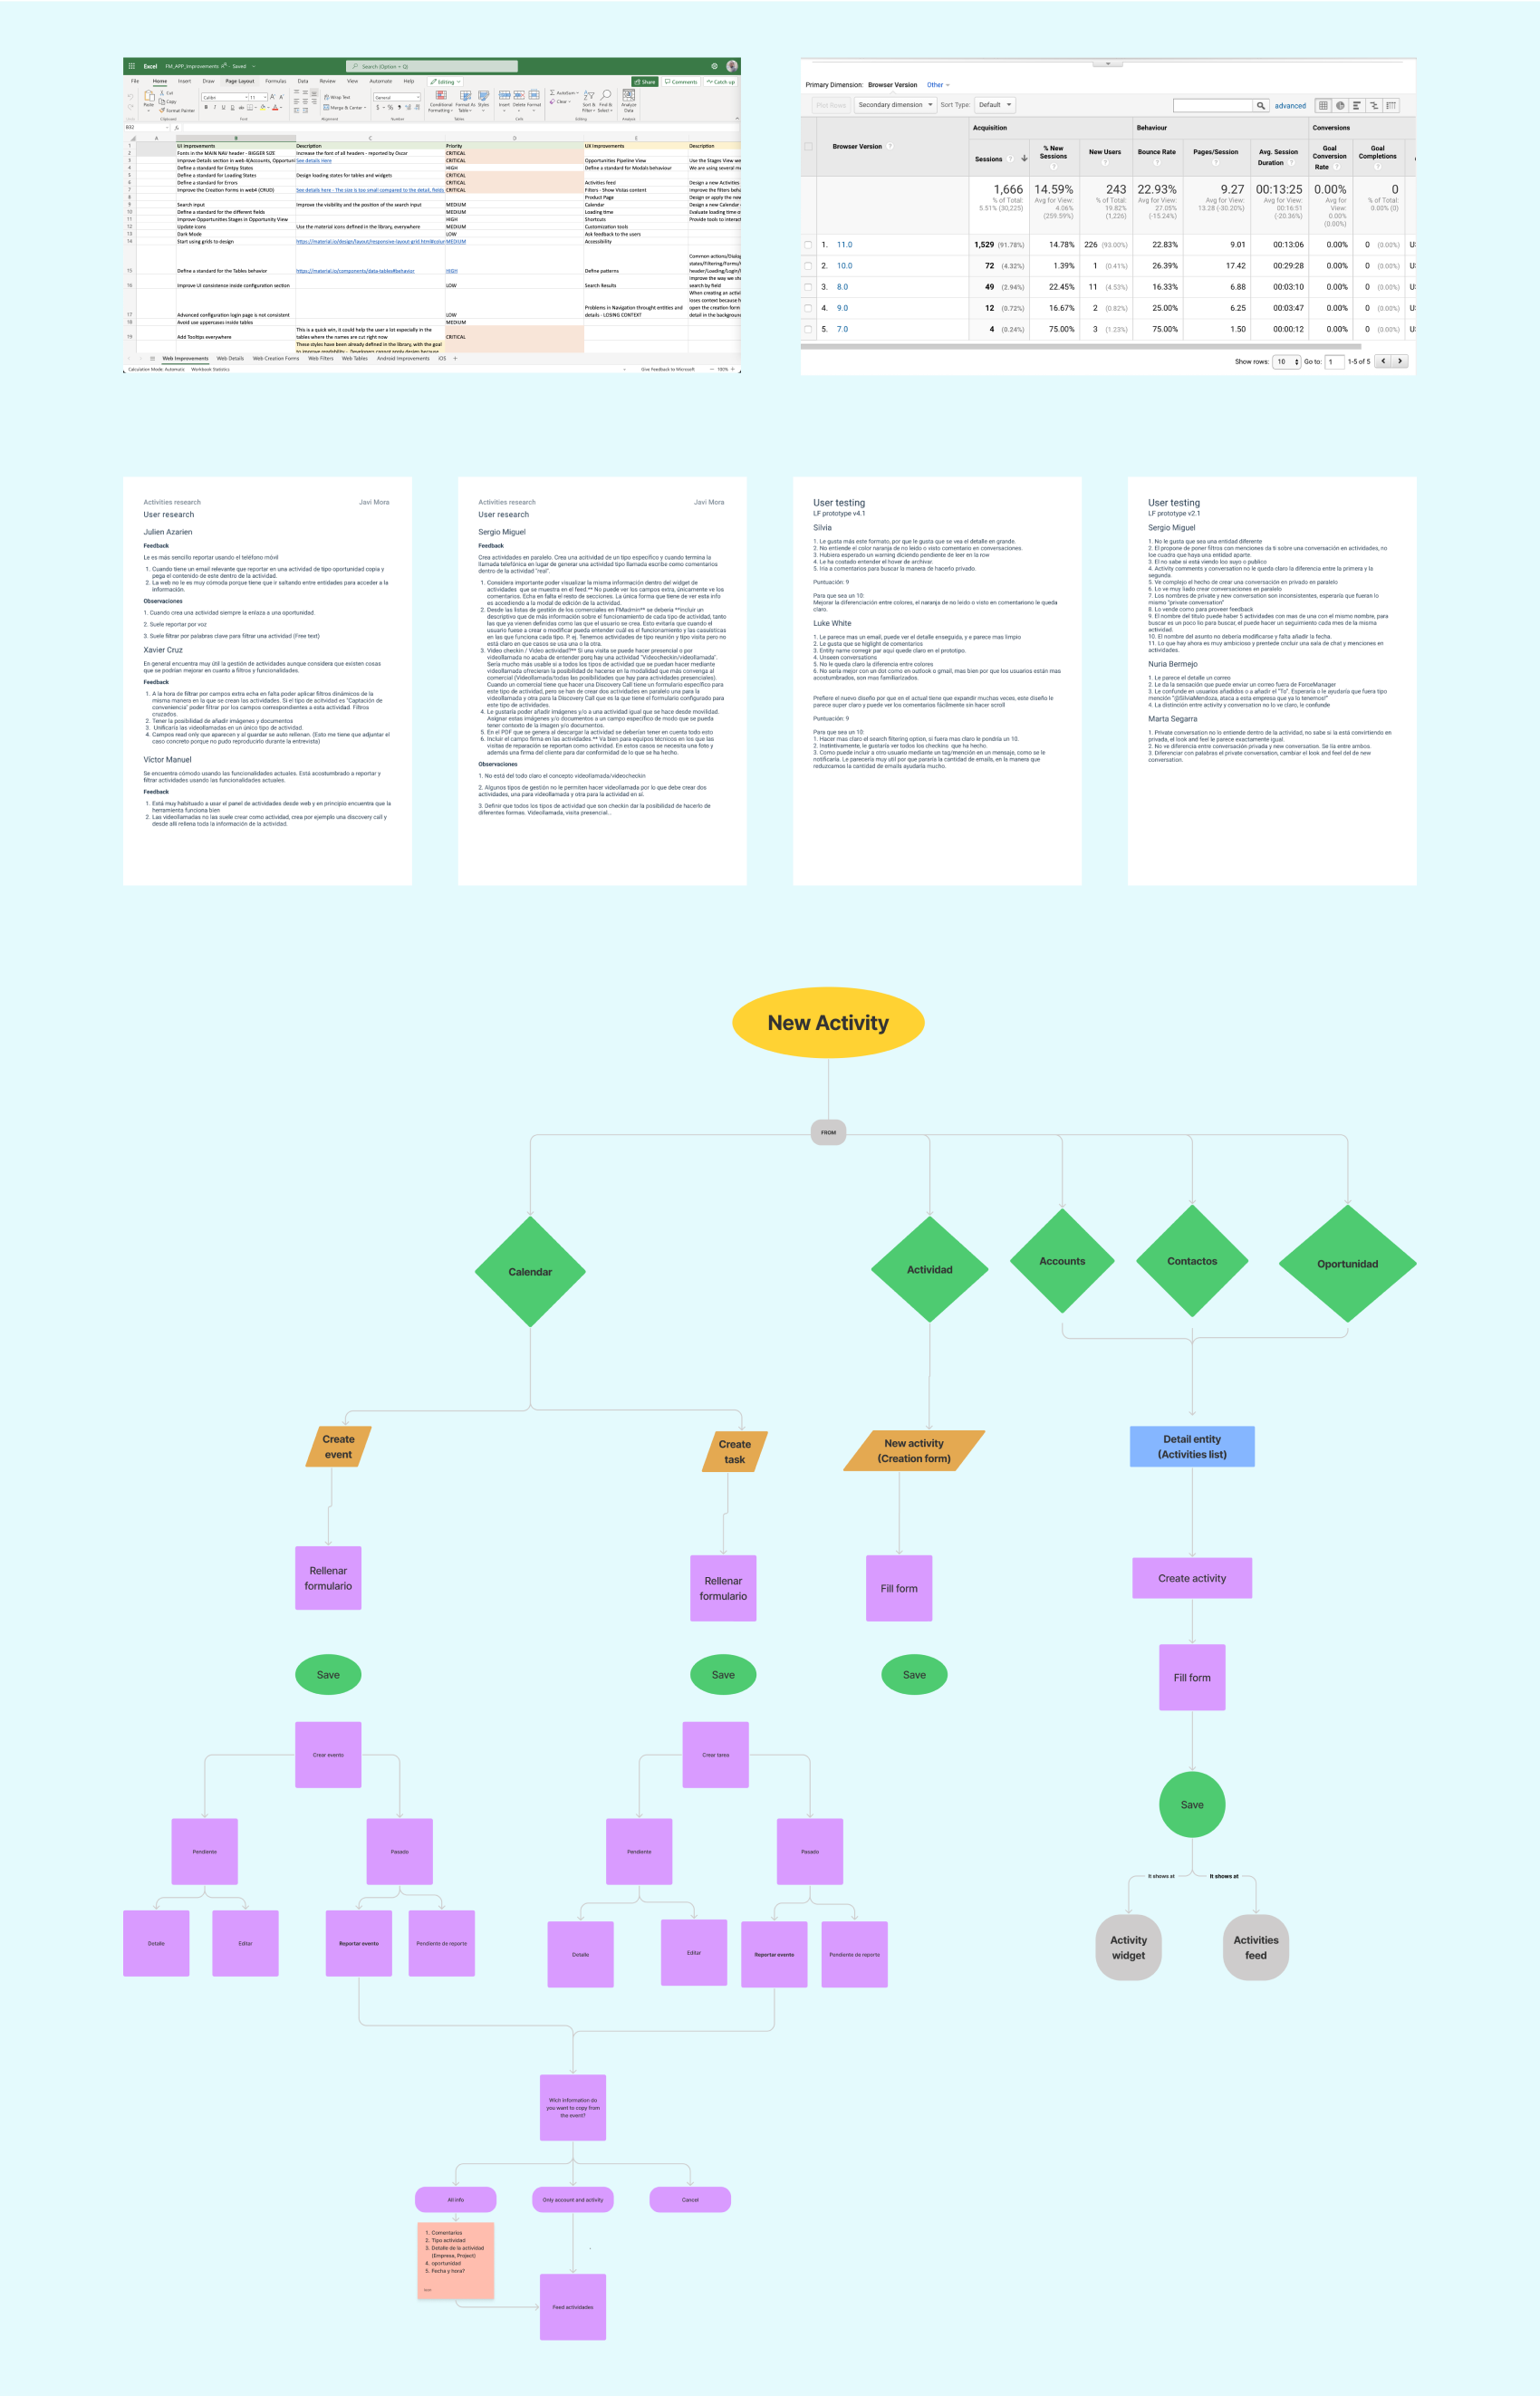
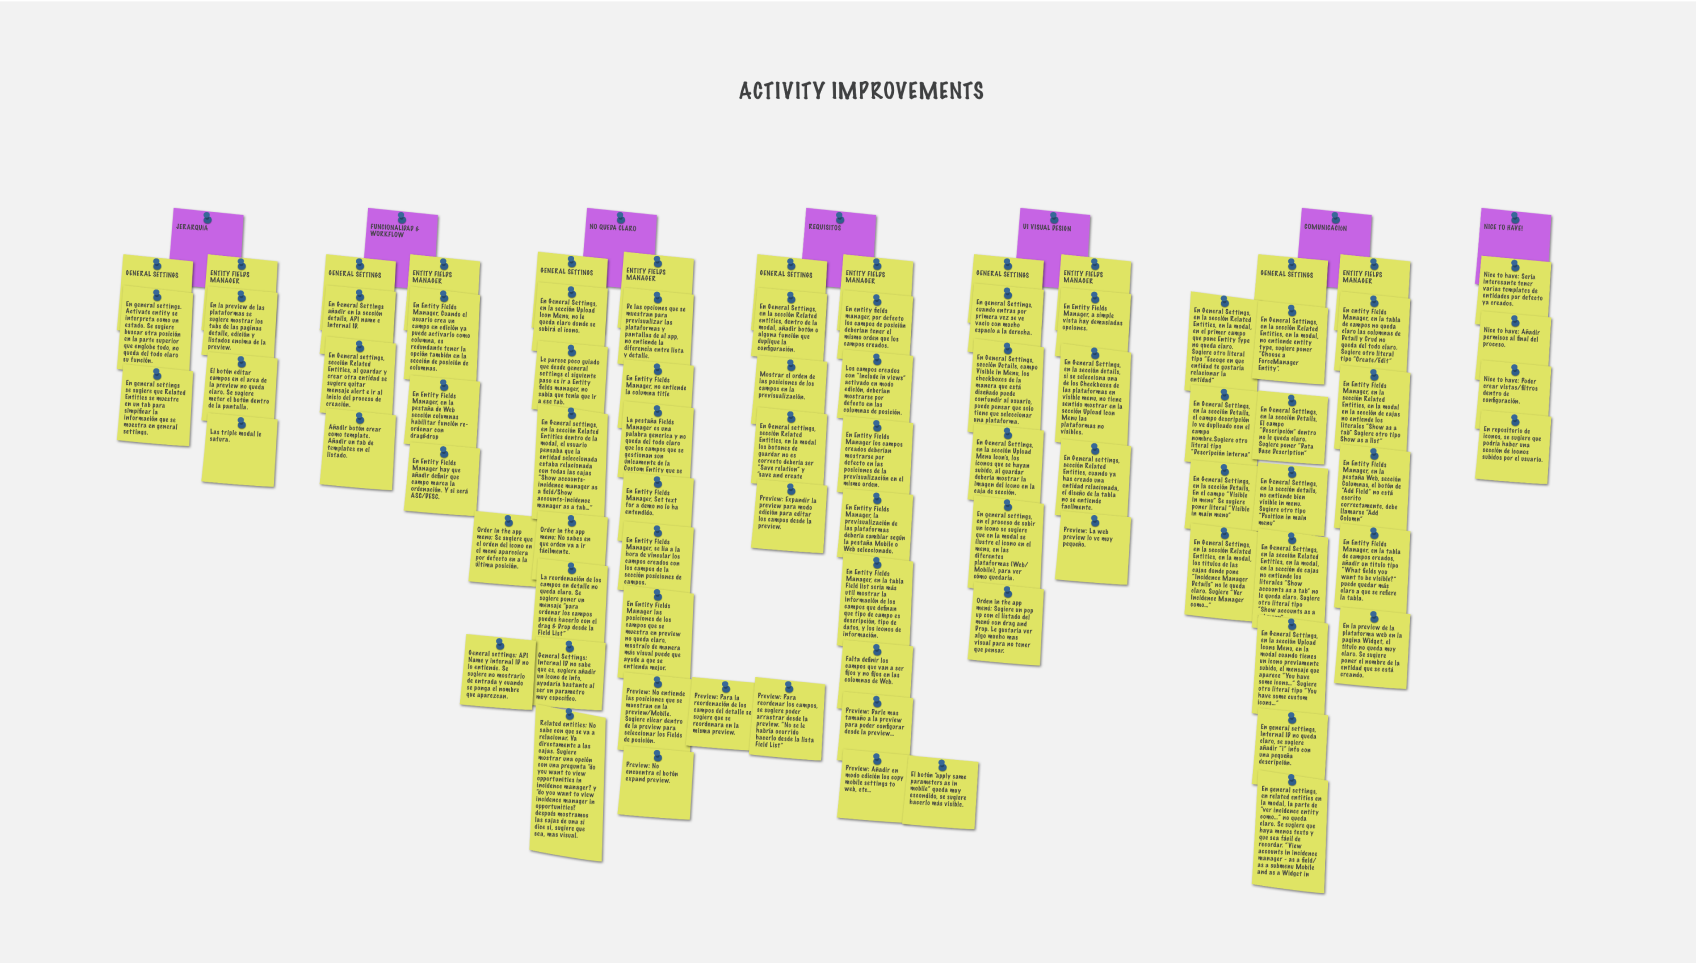
The initial interviews with users helped us to ground the project and start categorising problems and then with the help of the team and the PMs we defined a hierarchy according to their impact at a technical and functional level. Many data tables and Word documents to collect the information that we then shared in the meetings.
- 3.Scenarios.
To generate the scenarios we worked with metrics, data analysis and user journey to obtain information related to the type of devices accessed the section, to know if activities were created from here or it was more common to generate the reports automatically, what type of activities were reported more frequently? We were able to find out more about the user profiles that most accessed the feed. Managers and team coordinators accessed the feed most frequently to manage the activities of their team as a whole.
- 4.User goals and needs.
Once we defined all the problems in an extensive excel sheet we started to sort all this information, so we obtained a list with all the goals and needs of the users we had to work with.
- 5.User flows.
We created a new userflow that integrated all these possible solutions to make a mental map of the flow that the user interaction had to follow in the section. Technical validation. Meetings with the technical team to learn more about the feasibility of the project and its impact on technical development.
- 6.High fidelity prototype and design.
First sketches and design research process to start building on the library components and generate all those we need to build specifically for this project.
- 7.Users validation, analisis and iterations.
Interviews with users to start validating and testing the first prototypes. Gathering feedback and sensations from users when interacting with the prototype.
- 8.User testing.
Test with end users, feedback and iterate again.
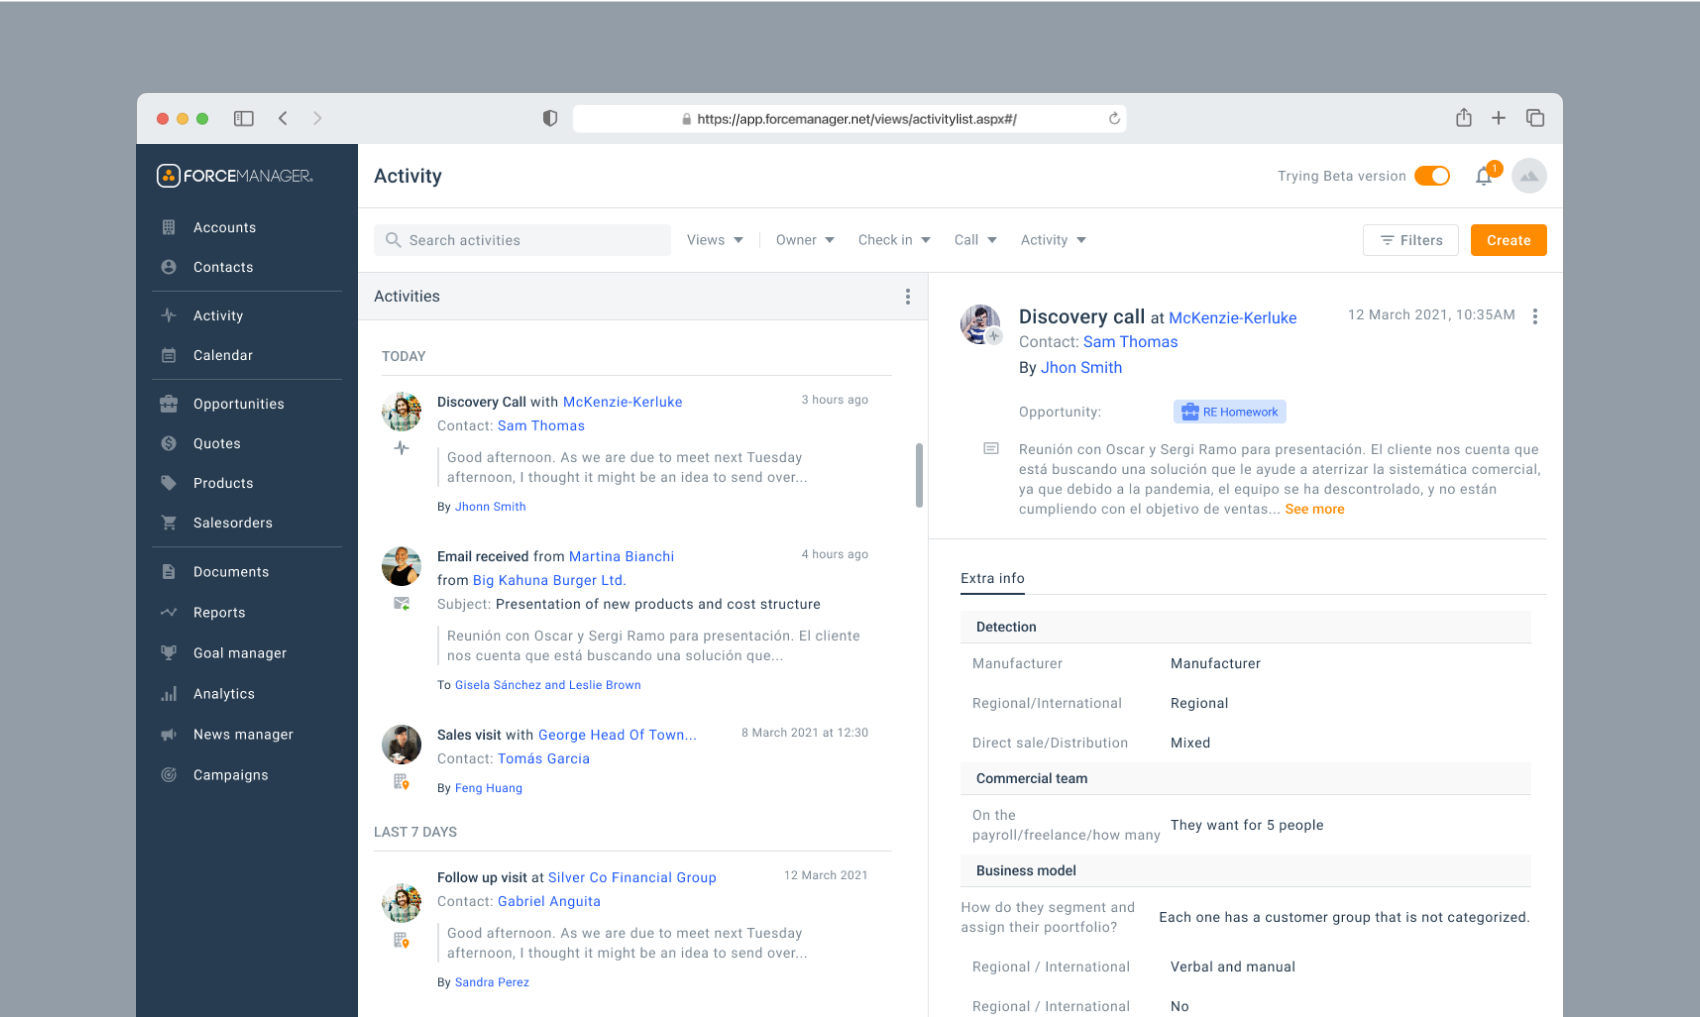
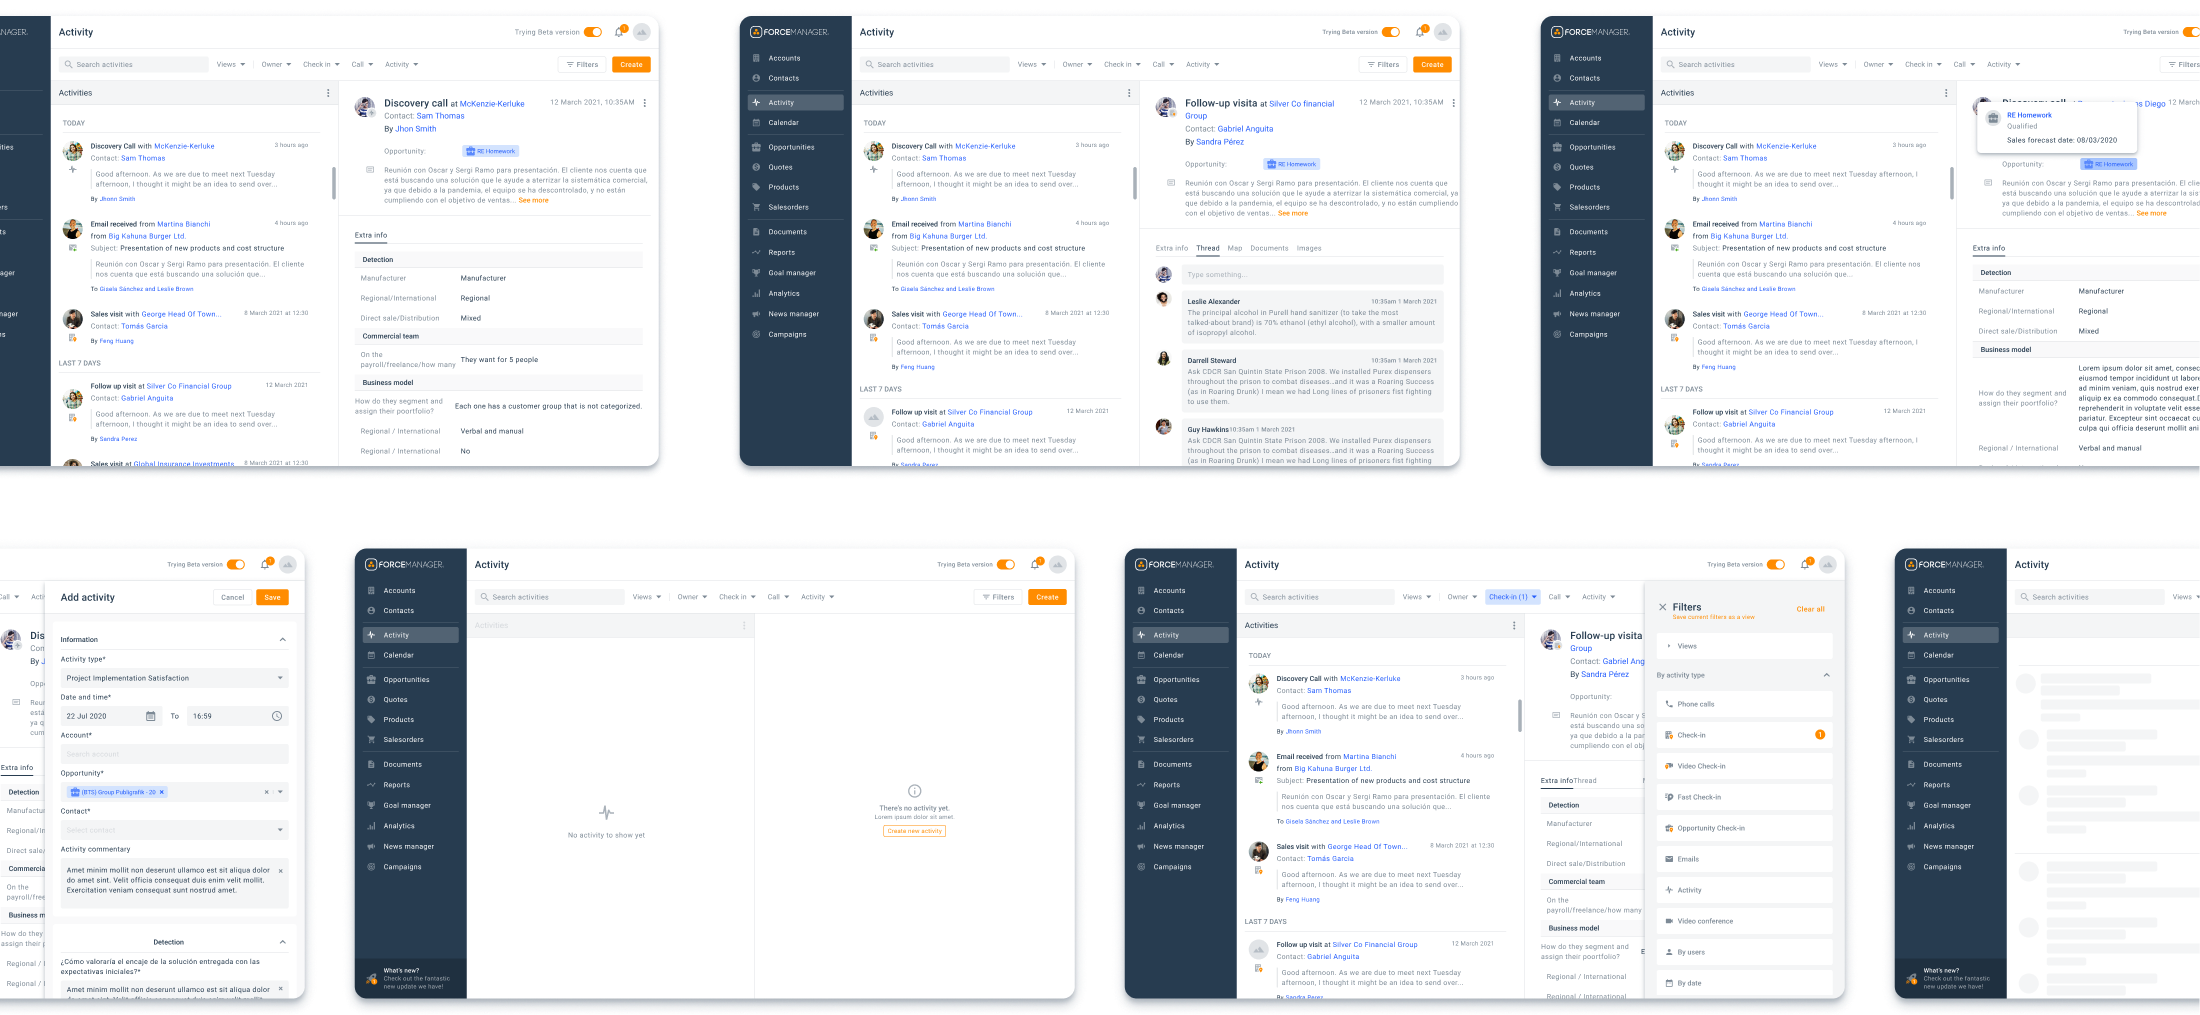
The main navigation is divided into two areas, on the left the activity feed in chronological order and on the right the details of each activity. This facilitates the "logical" reading from left to right; first the feed and then the detail.
- Conceptualize new product initiatives
- Collect quant and quali data to support design decisions
- Develop and maintain the design system